
⚡ TL;DR
- →The Indicator Studio is a live code workspace that ships today on ChartCrypto: a syntax-highlighted formula editor on the left, a real chart on the right, and a new result roughly a third of a second after every edit.
- →Three modes, one engine. Indicator plots your formulas on candles. Backtest turns
ENTRY/EXITlines into a full simulation with fees, slippage, stops and twelve metrics. Scanner walk-forward tests the same strategy across whole asset universes. - →Cross-asset by default. Crypto pairs, US stocks & ETFs, indices, forex and commodities run through the same formula language — one skill, every market.
- →Local-first and free. The engine is a WASM module running in your browser; nothing you write is uploaded, no account is needed, and your session restores itself on reload.
From preset indicators to your own
Every charting site hands you the same presets: RSI(14), MACD(12,26,9), Bollinger(20,2). They're useful — we ship dedicated pages for all of them. But presets end exactly where your own questions begin. What if you want RSI smoothed over 6 bars instead of 14? A volume surge defined against a 20-bar average rather than a fixed number? An entry rule that combines a momentum flip with a trend filter you invented?
Until now, crossing that line meant graduating to a full programming stack — download data, learn a scripting language, wire up a charting library, debug for an afternoon before you see a single line on a chart. Most people never cross it. The idea stays a wish.
The Studio is our answer: a workspace where writing an indicator feels like writing a spreadsheet formula, and the chart answers while you're still typing. This article is a tour of what it does, with real sessions on real market data — including a backtest that honestly loses to buy & hold, because a tool that only shows flattering numbers is a marketing device, not a research one.
🧭 The workspace
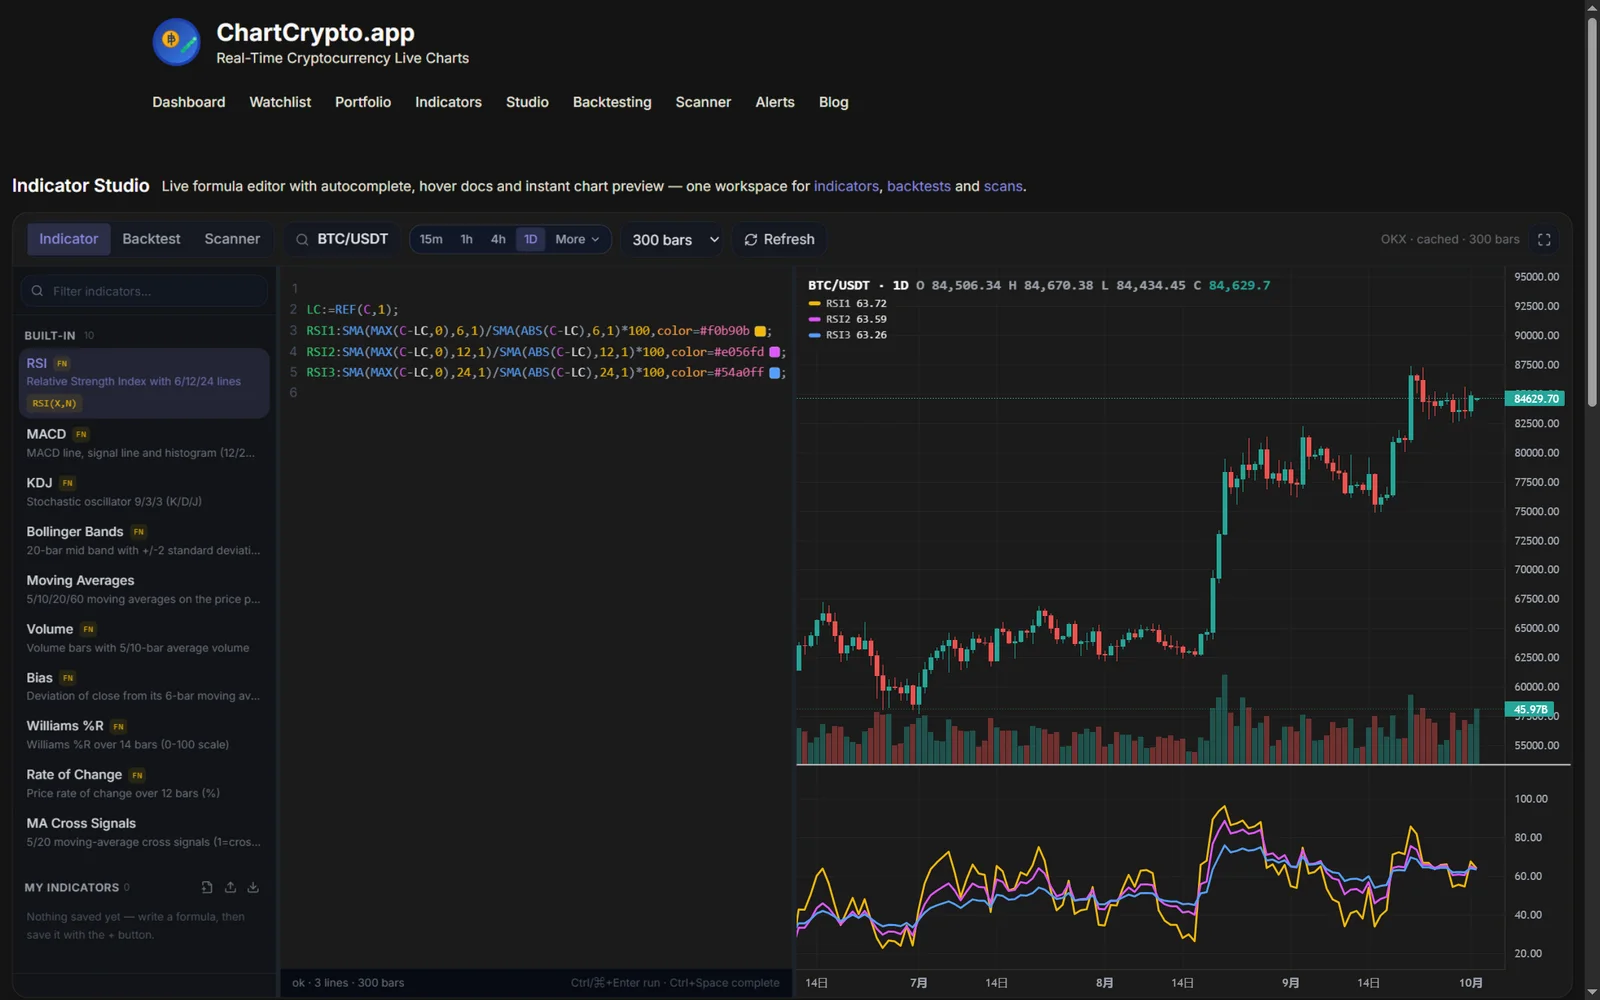
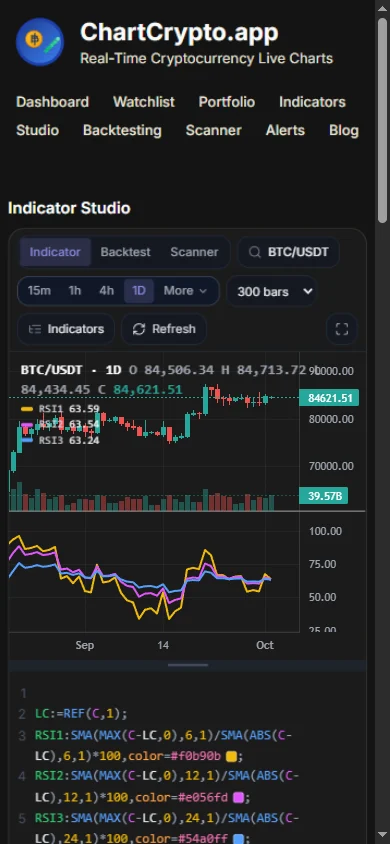
Three panels, no menus to hunt through. On the left, the indicator library — every built-in preset is one click away from being loaded into the editor as editable code. In the middle, the editor itself. On the right, the live preview: candles, volume, and whatever your formula draws, re-evaluated 350 ms after you stop typing. The status bar under the editor tells you, in plain text, whether the engine accepted your formula (ok · 3 lines · 300 bars) or exactly why it didn't.
A formula language you can learn in five minutes
The whole language is name, colon, expression, semicolon. Prices arrive as arrays — C close, O open, H high, L low, V volume — and 45 built-in functions (MA, EMA, RSI, CROSS, HHV, REF…) transform them into lines. The shot above renders this exact formula:
LC:=REF(C,1);                                                    ← intermediate variable
RSI1:SMA(MAX(C-LC,0),6,1)/SMA(ABS(C-LC),6,1)*100,color=#f0b90b;   ← output line, with color
RSI2:SMA(MAX(C-LC,0),12,1)/SMA(ABS(C-LC),12,1)*100,color=#e056fd;
RSI3:SMA(MAX(C-LC,0),24,1)/SMA(ABS(C-LC),24,1)*100,color=#54a0ff;
Three rules carry most of the weight: := defines a private variable, : defines a plotted output line, and color= styles it. Histograms (colorstick), dashed lines (dash) and boolean logic with AND/OR round it out. And the built-in indicators aren't black boxes — they're callable functions, so KDJ(9,3,3), MACD_DIF(12,26) or BOLL_UPPER(20,2) can appear inside your own formulas like any other function.
Because outputs are just declared, iterating is cheap: change the 6 to a 10, and a third of a second later the yellow line re-draws with the new smoothing. That tight loop — type, see, adjust — is the entire point of the Studio.
⌨️ An editor that teaches you the language
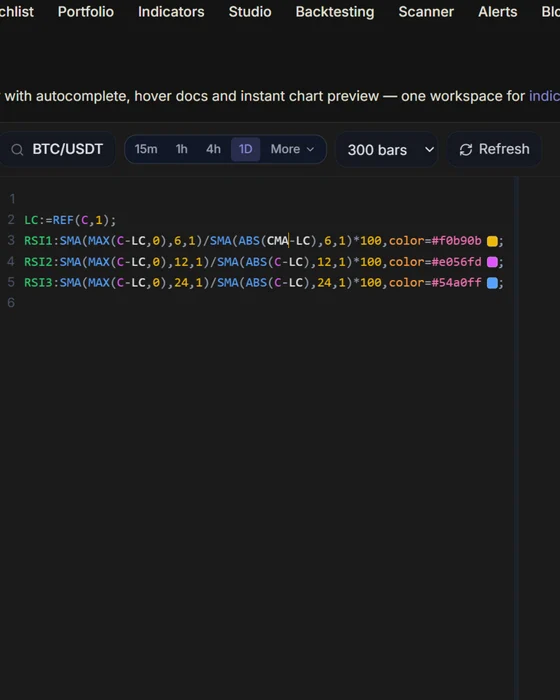
You don't have to memorize the function list. The editor is a real code-editing engine with multi-color syntax highlighting, and its autocomplete knows every function, variable and price array in scope — each completion carries its signature and a one-line description, so the doc you need is in the popup, not on another page. Hover any function for the same; hit Ctrl/⌘+Enter to run immediately instead of waiting for the debounce.
Backtest mode: from idea to evidence
Switch to the Backtest tab and the same editor becomes a strategy lab. Two magic names — ENTRY and EXIT — turn output lines into trade signals:
MA5:MA(C,5);                    ← plotted on the chart
MA20:MA(C,20);
ENTRY:CROSS(MA5,MA20);          ← long when fast MA crosses above slow
EXIT:CROSS(MA20,MA5);           ← flat when it crosses back
The simulation is honest by construction: fees and slippage in basis points, optional stop-loss and take-profit, long-only position accounting, and every trade marked on the chart. Below it, an equity curve plots your strategy against buy & hold for the same window.
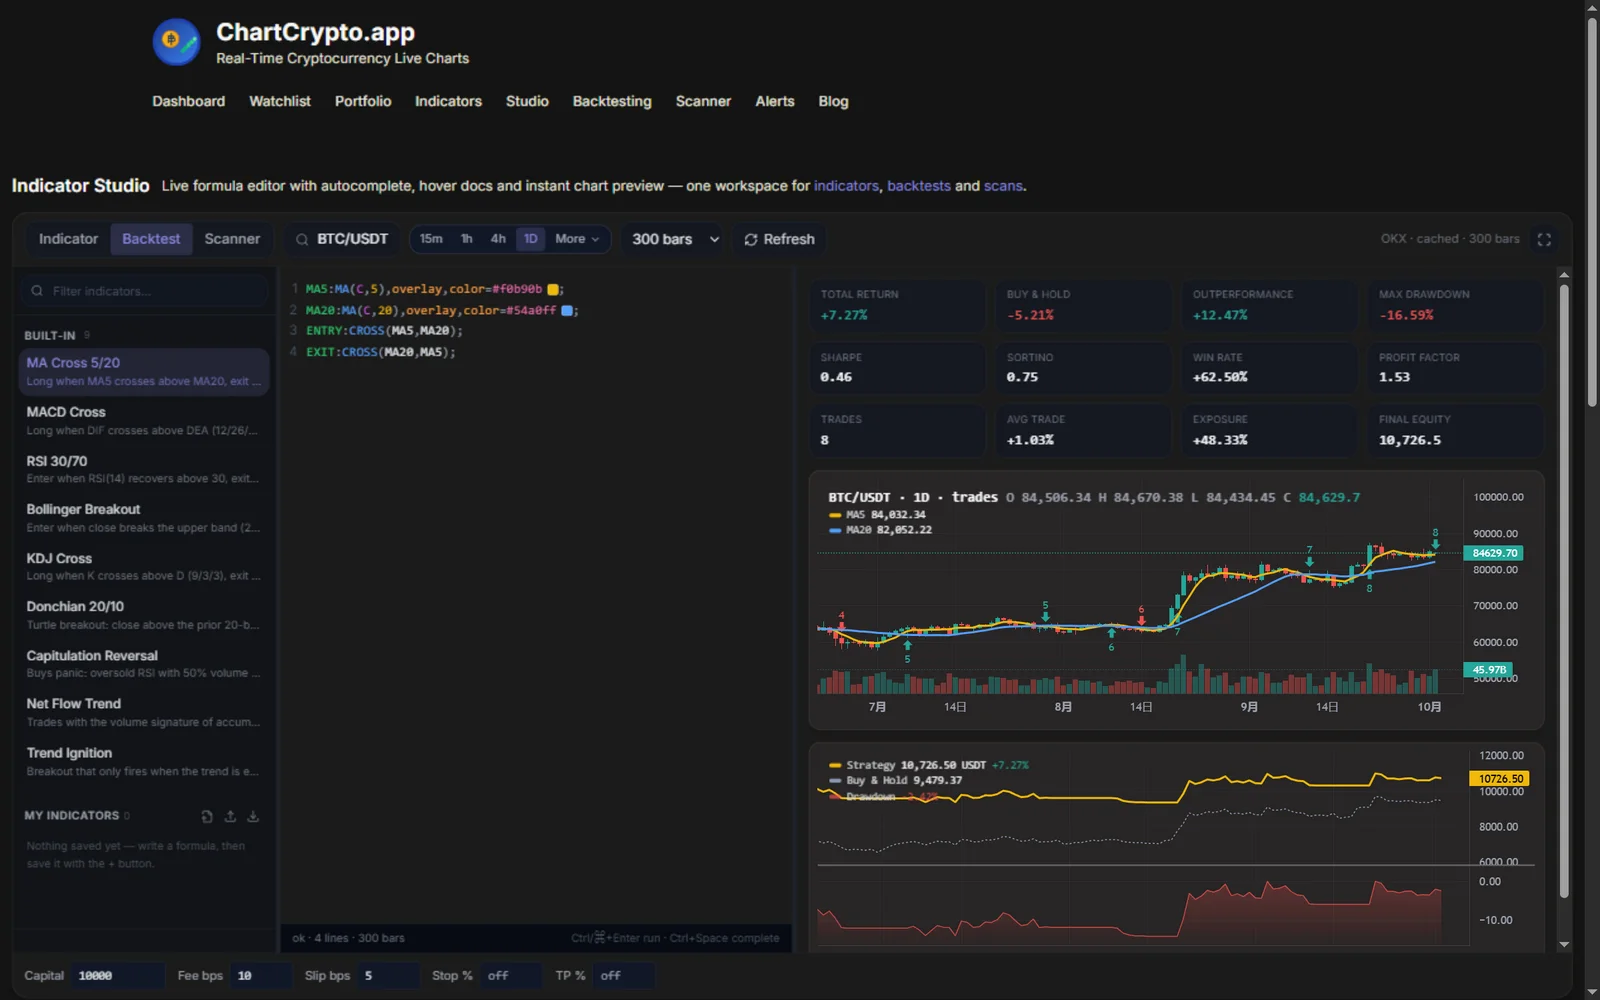
Why we're showing you a losing screenshot. Over this window BTC climbed from roughly $60,000 to $84,600, and a naive crossover gave back 2.3 points to simply holding — it was flat 44% of the time and paid fees on 28 round trips. That is the correct, unglamorous verdict for this strategy on this window, and seeing it took ten seconds. A backtester that can't tell you this is decoration.
Tweak anything — capital, fees, a 5% stop, a different pair or interval — and the whole simulation re-runs live, exactly like the indicator preview does.
🔭 Scanner mode: does it generalize?
One good backtest on one symbol proves little — that's how curve-fitted strategies are born. The Scanner mode runs the same ENTRY/EXIT strategy across an entire universe, splitting each symbol's history into an in-sample fit window and a held-out out-of-sample window (60/40, 70/30 or 80/20 — no lookahead, the out-of-sample segment is never visible while the strategy behaves the same everywhere). If an edge only exists in-sample, the table says so.
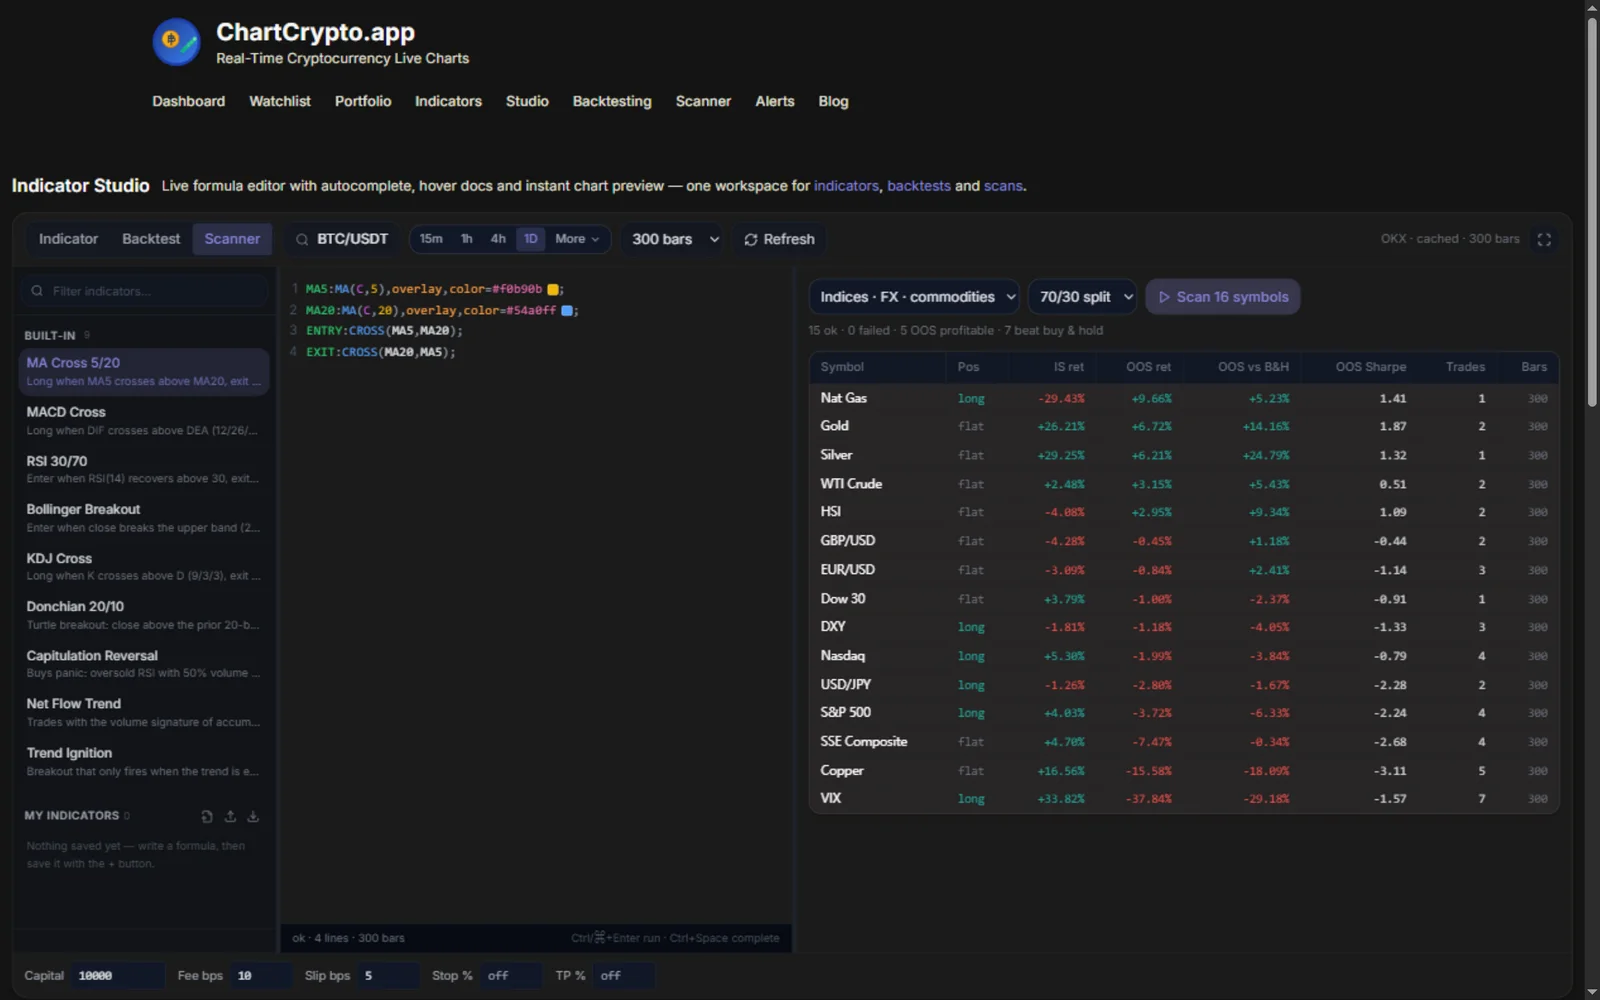
Four universes ship today: crypto majors, crypto top-20, US stocks & ETFs, and indices/FX/commodities. For parameterized strategies, the site's dedicated Multi-Coin Scanner adds a sensitivity sweep that re-runs the scan across parameter neighborhoods — the same anti-curve-fitting philosophy, one step further.
One engine, every asset class
Crypto is the home turf — pairs load with multi-source failover and aggressive client-side caching — but the Studio deliberately doesn't stop there. US stocks and ETFs (with a dividend-adjustment switch for total-return vs. quoted prices), global indices, forex pairs and commodities all flow into the same engine. Your skill compounds: the RSI formula you wrote for BTC this morning runs unchanged on gold or the S&P this afternoon. The symbol search even resolves tickers beyond the curated list, so the long tail is one query away.
Under the hood it's one WASM indicator engine — the same module that powers the Indicator Lab, the Strategy Backtester and the Multi-Coin Scanner. The Studio is simply the place where you hold the pen directly.
Yours, not uploaded
- →Local-first. Every formula, backtest and scan computes in your browser. Nothing you write leaves your machine, and there is no account to create.
- →Sessions restore. One formula per mode, plus your symbol and interval, persist locally — reload and you're exactly where you left off.
- →My indicators. Save formulas to a personal library in the sidebar, then export the whole thing as a JSON package to share or move between devices — and import one somebody sends you.
- →Fullscreen when you need it. One click expands the workspace to the whole screen; Esc brings you back.
🚀 Start in three steps
- Open the Indicator Studio — a working RSI variant loads immediately so you're never staring at a blank editor.
- Change a number. Watch the chart answer. That's the whole learning curve.
- When it looks interesting, flip to Backtest, add
ENTRY/EXITlines, then to Scanner to see if it survives contact with a whole universe.
Prefer curated starting points? The indicator catalog documents every preset with its full source, and our strategy design write-ups — Trend Ignition, Capitulation Reversal and Net Flow Trend — walk real strategies from hypothesis to formula to scan results.
The Studio is a research tool, not a trading signal. Every figure in this article comes from a live session on real market data, but past performance — in-sample or out — never guarantees future results. Formulas can contain bugs, data feeds can lag, and markets can change regime. Do your own research and only risk money you can afford to lose entirely.