
⚡ TL;DR
- →Most dip-buying loses money because it buys every dip. A dip is only buyable when the larger trend is up and the market has already rejected the low once. Trend Dip encodes exactly those two conditions.
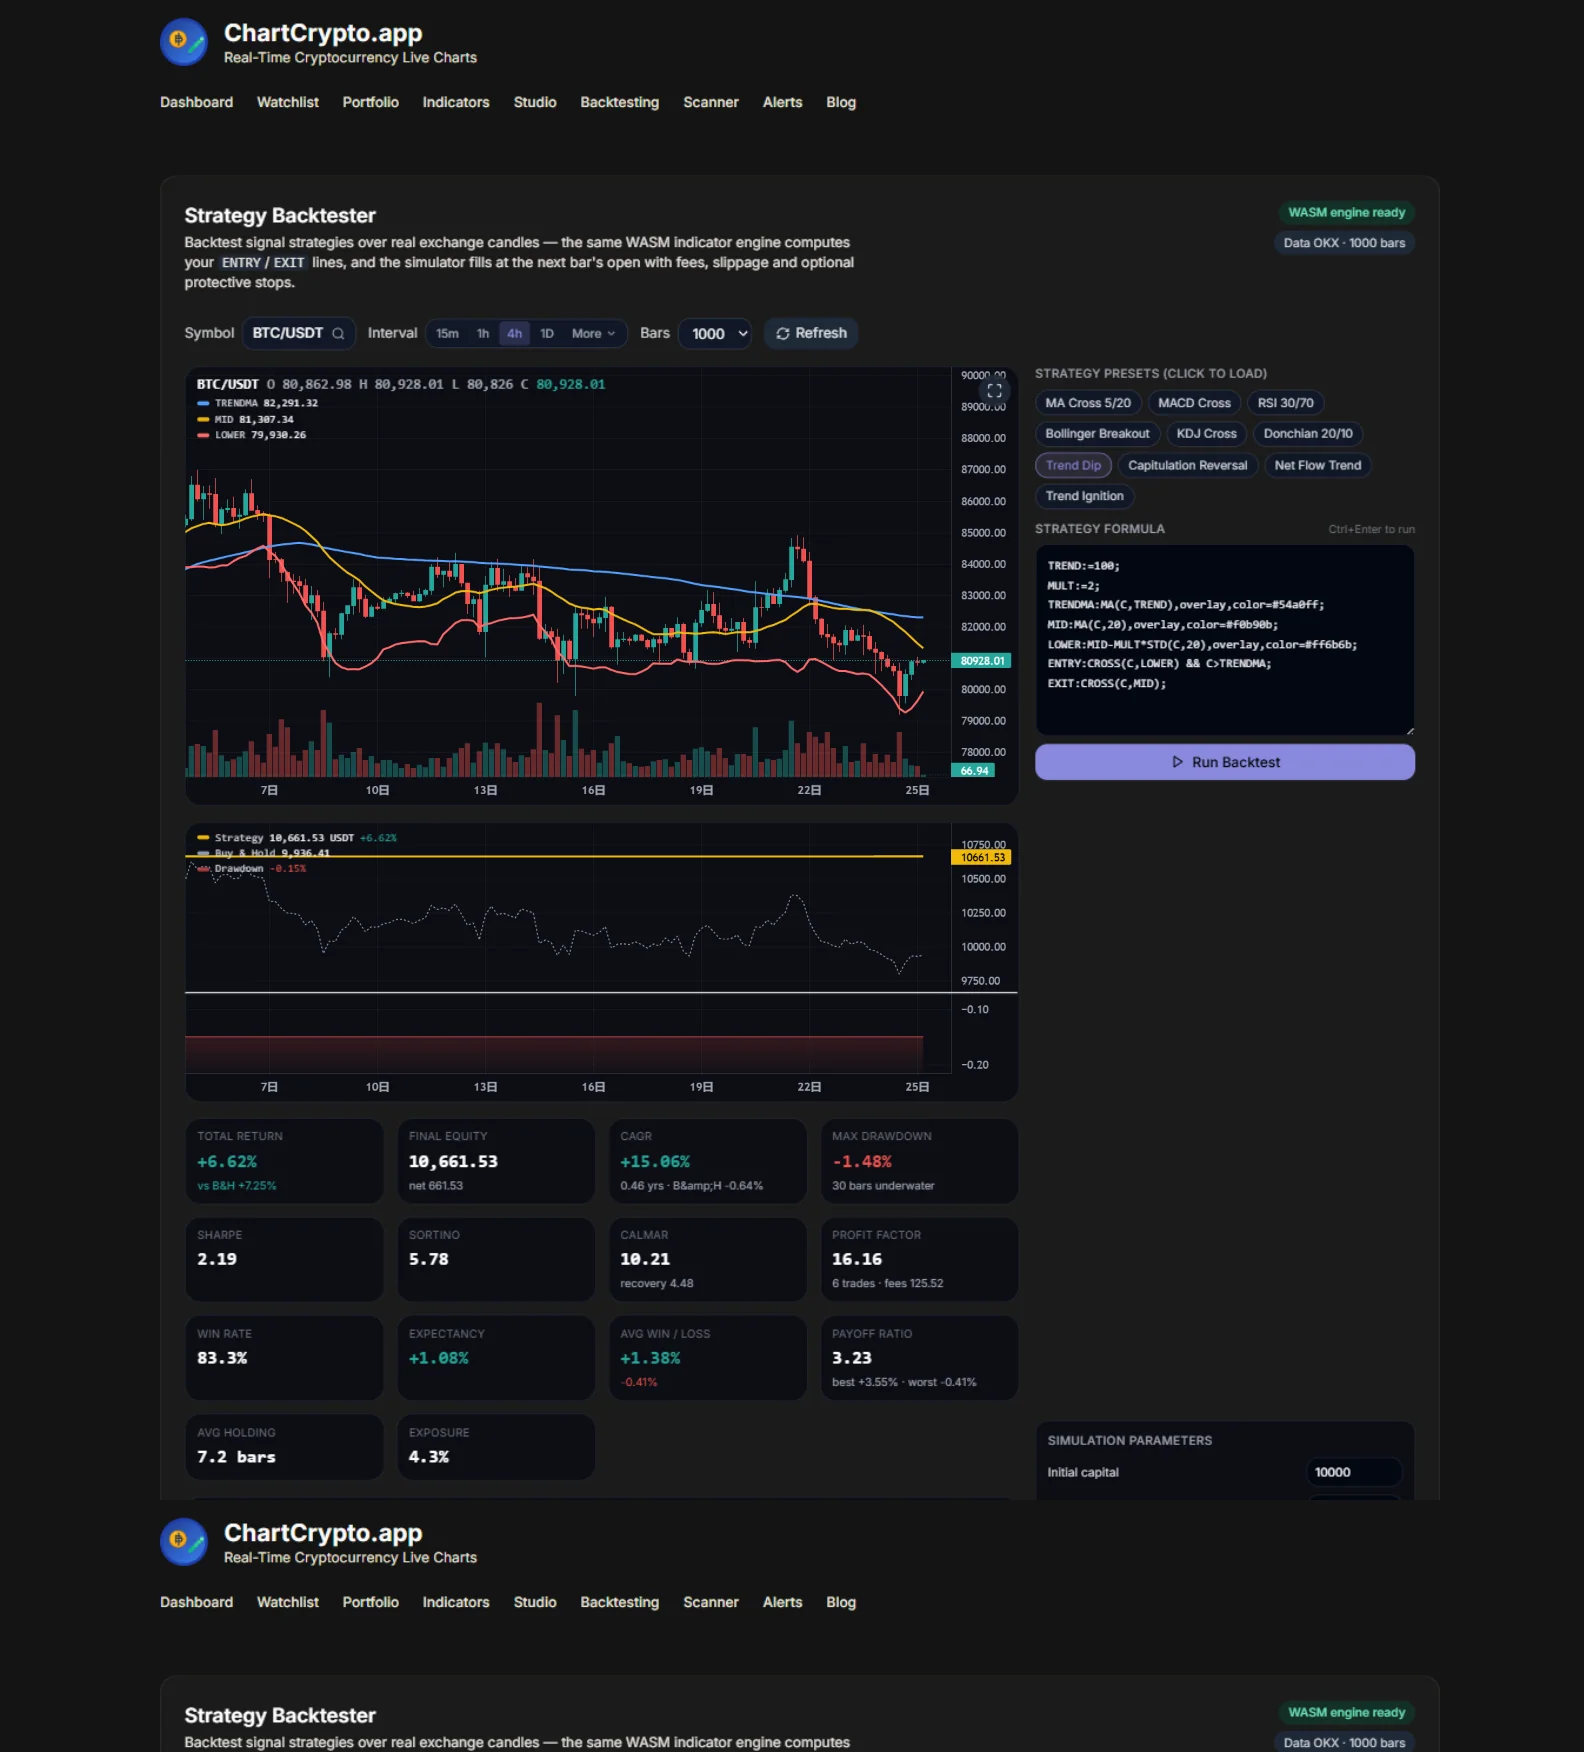
- →The rule is two lines: buy the bar whose close reclaims the lower Bollinger band (20, 2σ) while price is above its MA100; sell when the close returns to the mid band. No stop in the formula — the snap back to the mean is the trade.
- →Walk-forward validated, not curve-fit: 40 major coins, 4h bars, 70/30 in-sample/out-of-sample split, 0.1% fee + 0.05% slippage per side. Out-of-sample: 73.6% win rate over 174 trades, 26 of 40 coins profitable, median per-coin max drawdown around 6%.
- →Nothing to take on faith: the backtest page runs the exact rule on any pair in your browser, and the scanner walks it forward across the whole market. Free, no signup.
The most expensive advice in crypto
"Buy the dip" is probably the most repeated trading advice on crypto Twitter — and following it blindly is one of the most reliable ways to lose money. The problem is not the idea, it's the missing half: a dip is only a dip when the trend around it is up. Bitcoin pulling back 6% inside a bull market and a dying alt bleeding 6% on its way to zero print the same red candle. The first is an opportunity; the second is a knife.
The second problem is when you buy. Catching a falling price is guessing where the panic ends. What actually marks a local low is not the depth of the drop but the moment the market refuses to go lower — the first close that claws back above the level that broke.
Trend Dip is our answer to both problems, and it is now a first-class preset in the Strategy Backtester and the Multi-Coin Scanner. This article is the full story: the rule, the validation across 40 coins, the stress tests, and — most importantly — where it loses.
The rule
The whole strategy is four lines in our formula language:
TREND:=100;                                                    ← trend filter length
MULT:=2;                                                       ← band width in standard deviations
TRENDMA:MA(C,TREND),overlay;                                   ← the uptrend test
MID:MA(C,20),overlay;
LOWER:MID-MULT*STD(C,20),overlay;                              ← the dip line
ENTRY:CROSS(C,LOWER) && C>TRENDMA;                             ← buy the reclaim, in an uptrend
EXIT:CROSS(C,MID);                                             ← sell at the mean
Each piece earns its place:
- C > MA100 — the trend filter. This one condition is what separates a dip from a knife. Below the MA100, the same lower-band reclaim is ignored entirely. It deletes most of the losing trades a naked band strategy would take.
- CROSS(C, LOWER) — buy the reclaim, not the touch. The entry fires on the bar whose close comes back above the lower band, not the first bar that pierces it. The market has already rejected the low once before you spend a cent. In testing this single change moved the out-of-sample win rate by roughly ten points versus buying the touch.
- Exit at the mid band — let the mean do the work. The trade thesis is snap-back to the 20-bar mean, so that is where the trade ends. Simple, and it turns out hard to beat: we tried smarter exits (trailing lows, trend-break exits) and every one of them performed worse — you'll see the numbers below.
- No stop-loss in the formula. Deliberate, and the part people argue about most. The edge lives partly in the scary wicks: 4-hour crypto charts routinely flush 5% below the band and revert by the next close. A stop converts those winners into realized losses. We tested adding a 10%, 15% and 20% protective stop — the results were statistically indistinguishable (stops almost never fired), so we kept the formula minimal. The backtester still gives you an optional stop field if you want a hard tail cap.
How we validated it
A strategy is only as good as the test it survived. Ours had four rules, all of which matter:
- Not one chart — forty. 40 major coins with long histories (BTC, ETH, SOL, BNB, XRP, DOGE, AVAX, DOT and 32 more), because a rule that only works on a cherry-picked chart is a screenshot, not an edge.
- Walk-forward, not full-history. Each coin's ~500 days of 4-hour bars were split 70/30: the first 70% is where any parameter would effectively have been chosen, the final 30% is scored blind as one continuous out-of-sample segment. All headline numbers below are out-of-sample only.
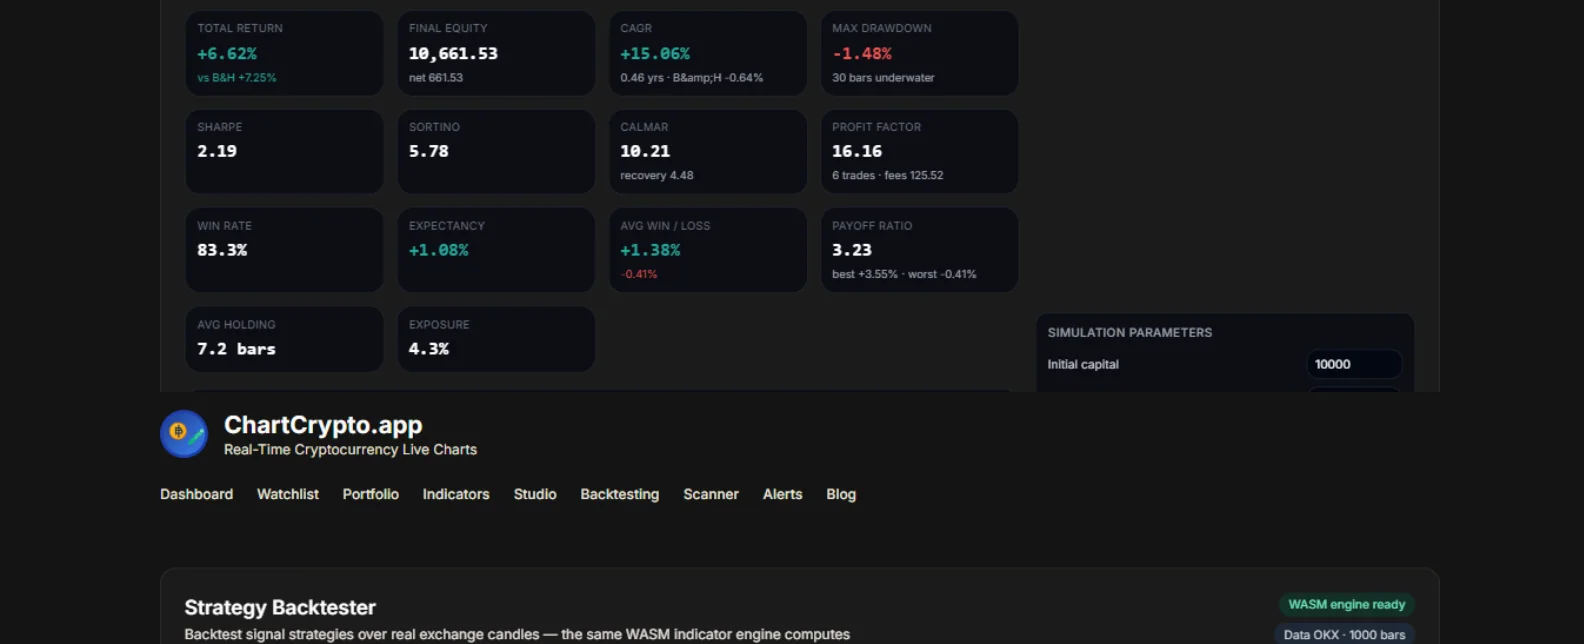
- Realistic fills. Signals confirm at bar close and fill at the next bar's open — no lookahead — with a 0.10% taker fee and 0.05% slippage per side, roughly 0.3% round trip. The same WASM engine and simulator that power the public backtest page ran every test.
- Benchmarks. The same harness scored all nine existing strategies on the site — MA Cross, MACD Cross, RSI 30/70, Bollinger Breakout, KDJ Cross, Donchian 20/10, Capitulation Reversal, Net Flow Trend and Trend Ignition — on identical data.
The numbers
| Out-of-sample metric (40 coins, 4h, 70/30) | Result |
|---|---|
| Win rate, all held-out trades combined | 73.6% (174 trades) |
| Win rate, in-sample (for contrast) | 62.9% (267 trades) |
| Coins profitable out-of-sample | 26 of 40 |
| Coins beating buy & hold out-of-sample | 24 of 40 |
| Coins winning ≥50% of held-out trades | 33 of 35 with ≥3 trades |
| Median per-coin max drawdown | −6.1% |
| Worst / median / best held-out trade | −16.7% / +1.2% / +34.8% |
| Average holding time | 12 bars ≈ 2 days |
| Win rate at 2× fees (0.2% + 0.1% per side) | 69.5% |
| Win rate at 3× fees | 64.9% |
| Majors: BTC / ETH / SOL / BNB / XRP / DOGE win rate | 83% / 75% / 100% / 100% / 100% / 100% |
Two details in that table deserve a second look. First, the out-of-sample win rate is higher than the in-sample one — 73.6% versus 62.9%. Overfit strategies show the opposite signature: brilliant in the tuning window, collapsing the moment the data is unfamiliar. Second, the edge survives fees that are two to three times what a normal spot account pays. Strategies that only work at zero fees don't work.
Trying hard to break it
High win rates are easy to fake and easy to luck into, so we ran four break-it checks:
- Time slices. Split each coin's history into six consecutive windows and score them separately: win rates came out 71%, 56%, 62%, 55%, 69%, 75% — every single window above 50%. A regime-dependent fluke does not do that.
- Parameter plateau. The defaults (20 bars, 2σ, MA100) sit in the middle of a plateau, not on a spike: band widths from 1.8σ to 2.5σ all won 70–77%, and neighbouring trend filters (50–200) all stayed positive. When a strategy's performance collapses if you nudge a parameter by 10%, you found noise, not an edge.
- Split-date sensitivity. Moving the walk-forward cut across 50/30 to 90/10 changed the aggregate win rate only between 55% and 66%. Results that swing wildly with the split date usually mean the edge lives in one lucky month.
- Exit shoot-outs. We tried adding a 10-bar-low emergency exit and a trend-break exit to the formula. Both lowered the out-of-sample win rate (to 61.5% and 51.0%). The boring mid-band exit won — stops were selling into the very wicks the strategy profits from reverting.
Against the benchmarks: on the same data, the same harness, the best of the nine existing strategies managed a 51% out-of-sample win rate on 4h bars. Trend Dip's nearest neighbor, the classic RSI 30/70 mean-reversion rule, won 51.3% with a median max drawdown four times larger.
Where it loses — read this part
No honest strategy article skips this section.
- A 73.6% win rate is not a money printer. The median winning trade is small (+1.2%) because the target — the mid band — is close. The profile is many small wins, occasional multi-day runners, and occasional give-backs; it is a swing-trading rhythm, not a compounding machine. The worst held-out trade lost 16.7%.
- No formula stop means tail exposure exists. The MA100 filter and the mid-band exit have historically capped the damage, but a coin that breaks down mid-trade and never recovers to the mid band holds until it does. If that keeps you up at night, set the optional stop in the backtester — and accept slightly worse expected numbers for a hard floor.
- The test window is one market regime. The held-out segment is roughly the last five months per coin. It covered dips inside an uptrending market — exactly the environment the rule is built for. In a full bear market the MA100 filter will simply keep it flat for long stretches (which is the designed behavior, not a bonus).
- Survivorship bias is real. Today's top-40 list excludes the coins that died. Some losers were filtered out before the test began.
🌐 Run it across the whole market
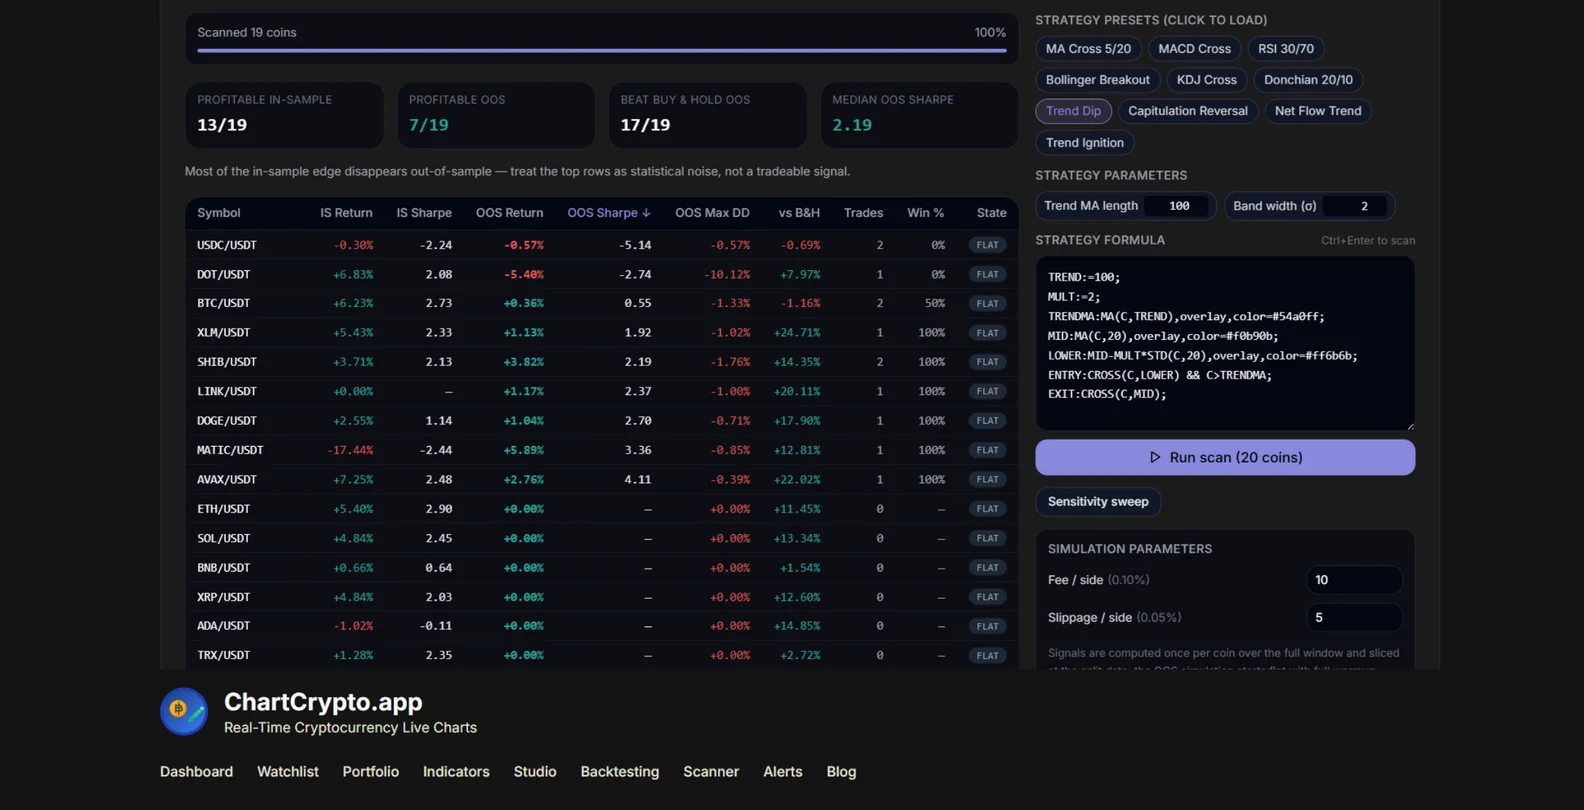
One coin's backtest is an anecdote. The Trend Dip scanner page runs the identical formula across a whole universe of coins in one pass — each split walk-forward, ranked by out-of-sample Sharpe, with the summary counters that tell you whether the edge is broad or concentrated in a few lucky charts.
Make it yours
Trend Dip ships as a preset, not a black box. On the backtest page the formula is fully editable: change the trend length (TREND:=100;) or the band width (MULT:=2;), retune the fees to your actual tier, add a stop — the whole simulation reruns in your browser in under a second. The scanner takes the same edits universe-wide.
If the design thinking here interests you, we wrote up the other strategies in the same series: Capitulation Reversal (buying panic with a volume fingerprint), Trend Ignition (breakouts that demand conviction) and Net Flow Trend (trends confirmed by order flow). They are deliberate opposites of each other — this one refuses to chase strength, those refuse to catch falling knives.
Pull up your own coin, set the interval to 4h, and see what the last year of dips paid. That's the whole point of building the tool.
Disclaimer: all figures in this article come from historical backtests (October 2026) over Binance spot 4-hour candles with simulated fills, fees and slippage; they describe what the rule would have done, not what it will do. Backtested win rates decay in live trading. Nothing here is financial advice — crypto assets are volatile and you can lose your entire investment. Do your own research, and size positions like the worst trade in that table is coming for you.